Friday, October 14, 2016

How to associate statistics to a function - Part 2

In our second and last part about association of statistics to PL/SQL functions in Oracle we’ll take a look at how to estimate I/O and CPU usage.

First we’ll try to measure I/O. Let’s have a procedure discount from an online shop. All that it does is that I takes order ID and applies requested discount on it. For I/O measurement we’ll use handy PL/SQL program called mystats which is variation on Jonathan Lewis's SNAP_MY_STATS package to report the resource consumption of a unit of work between two snapshots. You can get it here: https://github.com/oracle-developer/mystats.

Simple example of usage should look like follows:

set serveroutput on
/

begin
 mystats_pkg.ms_start;
end;
/

begin
 discount(1,20);
end;
/

begin
 mystats_pkg.ms_stop(mystats_pkg.statname_ntt('consistent gets','db block gets'));
end;
/

rollback
/


Output will look something like this:


From report we see that our measured I/O is 14. This is very simple and probably not very representative test. It would be a good idea to give procedure more iterations over different data and then divide results by number of iterations.

Now that we now how much I/O will function usually consume, we can focus on CPU.  For CPU estimate we will use PL/SQL function called DBMS_ODCI.ESTIMATE_CPU_UNITS (https://docs.oracle.com/cd/B19306_01/appdev.102/b14258/d_odci.htm#i996771) which returns the approximate number of CPU instructions (in thousands) corresponding to a specified time interval (in seconds).

We can do something like this with following output:

set serveroutput on
/

declare
 v_start PLS_INTEGER := DBMS_UTILITY.GET_TIME;
 v_end PLS_INTEGER;
begin
 mtg.order_pkg.discount(1,20);
 v_end := DBMS_UTILITY.GET_TIME;
 dbms_output.put_line('Time:'||to_char((v_end-v_start)/100,'999,999.999'));
 DBMS_OUTPUT.PUT_LINE(ROUND(1000 * DBMS_ODCI.ESTIMATE_CPU_UNITS(v_end-v_start)/100,0));
end;
/


rollback
/


Again I would advise you to give it more iterations to get nicer picture a use average value.

Wednesday, August 31, 2016

How to associate statistics to a function - Part 1

It has been a long time since my last post and I’m sorry for that. I’ve been very busy lately and a lot of things happened in my life. Most importantly; I’ve finally decided to move to the next level and I’ve founded my own company – Terama Consulting. You can check our web site here http://www.terama.consulting. We focus mainly on IT consulting, employee training and small cloud services. Feel free to contact us :).

Now, last time we asked ourselves an interesting question. How does Oracle order predicates in where clause and how to tell him how expensive our function really is. Reason for this is that Oracle has none to very limited way to say how CPU or I/O intensive your function is.

We’ll break our post into two parts. In first part, we will learn how to give Oracle information he needs for best possible decision. And second part, where we actually learn how to measure resource consumption, so we know what to tell to Oracle.

So, how to give Oracle information about cost and other attributes of our function?

Answer is quite simple: ASSOCIATE STATISTICS

Purpose of this statement is to associate statistic of given type to our function. By using it, we can tell Oracle what is the CPU cost or our function, what is its selectivity, I/O cost, etc.

Let’s have a look on our options here. We can associate statistics with following object types, while only one set of statistics may be attached to that object:
• Columns
• Functions
• Packages
• Types
• Indexes
• Indextypes

There are certain limitations to what you can set with what object type but I don’t think we need to go into so much detail here. You can study Oracle documentation for that (https://docs.oracle.com/cd/B28359_01/server.111/b28286/statements_4006.htm).

Now, let’s see what statistics you can associate with your objects:
• CPU cost (number of units greater than 0)
• I/O cost (number of units greater than 0)
• Network cost (not implemented as of 12c)
• Selectivity (number between 0 and 100 where 100 means no filtering at all)

Here are some usage examples:

Selectivity 5%:
ASSOCIATE STATISTICS WITH FUNCTIONS my_where_func DEFAULT SELECTIVITY 5;

CPU cost 950, I/O cost 11 and network cost of 0 (which you can happily ignore):
ASSOCIATE STATISTICS WITH FUNCTIONS my_where_func DEFAULT COST (950,11,0);

All together on one function:
ASSOCIATE STATISTICS WITH FUNCTIONS my_where_func DEFAULT SELECTIVITY 5 DEFAULT COST (950,11,0);

Now it would be a nice time for some execution plans where we play with statistics, but I think you’ve already got the trick. So no execution plans for today and see you in next part :)

Sunday, May 29, 2016

Where clause predicate evaluation order


On my lectures I get quite often asked about how Oracle chooses evaluation order in where clause. It’s quite interesting question so I’ve decided to make today’s blog post about that. Officially Oracle says as follows:

Some of the things that influence the order of application of the predicates are:
• Their position in the WHERE clause
• The kind of operators involved
• Automatic Datatype conversion
• The presence of bind variables
• Joins
• The optimizer mode (Rule or Cost)
• The cost model (IO or CPU)
• The Query Rewrite feature
• Distributed operations
• View merging
• Query Un-nesting
• Other Documented and Undocumented Parameters
• Hints

In addition, the optimizer can also add, transform or remove predicates. One example being transitivity:

a=1 AND a=b

Seeing that, Optimizer knows that b must be equal 1 and adds that to where clause creating following result

a=1 AND a=b AND b=1

This all might seem little confusing. So let’s simplify all of this in one sentence. Basically Oracle is trying to figure out best order of evaluation of predicates so that he can as soon as possible AND as cheaply as possible find out that he can throw away current row. So in that context he wants to check most selective and cheapest predicates first so he can cheaply and right away find out that he does not want current row.

After all we have said here you’ll definitely deduce, that Oracle will very likely evaluate constant predicate 1st, functions second and he will try to keep those pesky subqueries to the last if possible.

Well that is logical, right? Yes, it is and a lot of developers know that and tend to count on that … and bad things happen as usual :)

Let’s make a little demonstration:

CREATE TABLE where_table AS
SELECT * FROM dba_objects;
UPDATE where_table SET object_type = NULL WHERE object_type != 'INDEX';
COMMIT;

CREATE OR REPLACE FUNCTION my_where_func(
    v VARCHAR2)
  RETURN VARCHAR2 DETERMINISTIC
IS
  d pls_integer;
BEGIN
  IF v='INDEX' THEN
    RETURN(v);
  ELSE
    RAISE_APPLICATION_ERROR(-20000, 'NULL not allowed');
  END IF;
END;
/

As you can see, we have a table which is copy of dba_objects and we make it so that object_type column has value NULL or INDEX. Our function is also very simple. When it gets INDEX it returns INDEX. On any other value it throws an error.

Ok. Now let’s have this simple query:

SELECT *
FROM where_table
WHERE owner                   IS NOT NULL
AND object_type                = 'INDEX'
AND my_where_func(object_type) = 'INDEX';

Logically, Oracle will evaluate if object_type is equal to INDEX 1st (its cheapest and most selective check), then he will check whether owner is not null (still very cheap but not so selective) and after all of that, IF row still survives, he’ll call our function (it costs him more CPU then previous predicates).

Now let us run our query and see what we get:

SQL Error: ORA-20000: NULL not allowed
ORA-06512: at "TESTDBA.MY_WHERE_FUNC", line 9

Now being very clever reader you are, you know that only way this can happen is that our function was called with NULL. But how is this even possible when object_type = 'INDEX' should be checked 1st. Ok, let us see the execution plan:


Well, this is not what we were expecting at all. This is not even remotely right. But how is this possible? Well the reason is simple … I cheated. After the creation of my_where_func I ran this:

ASSOCIATE STATISTICS WITH FUNCTIONs my_where_func DEFAULT COST (1,0,0);

Basically I told Oracle that CPU cost of that function is 1, IO cost is 0 and network cost is 0. So he thinks it’s very very cheap. You might wonder what my point here is. Well, my point is that sometimes Oracle messes up (wrong stats, damaged stats) and will do things like this. You should take that into account when designing your functions. Just a month ago I was helping with issue when report ran for 1 year without any problem and on one day from 23:44 it started to crush with ORA-06502: PL/SQL: numeric or value error: NULL index table key value. Problem was same select as stated before and developer counted on Oracle to call his function last. He was using passed value as a key to associative array and didn’t check the input ‘cos he knew that all not null values must be in index of that array. But Oracle did change order of evaluation and null happened.

Now don’t forget that we are talking about filter predicates. Access predicates on indexes are of course used first.

You might ask youself what happens when Oracle can’t decide which of your two predicates is more expensive. Well he keeps them in order you placed them in your where clause. So sometimes it is good to do a little ordering in your where clause. BUT best think you can do is to TELL Oracle how much each of your functions costs so he knows. We’ll look at how to do that next time.


Wednesday, May 18, 2016

Think simple and spare yourself a facepalm session

I think it’s time to share my presentation from Think simple and spare yourself a facepalm session, which I was presenting at BGOUG & DOAG 2015:

Wednesday, May 11, 2016

Beginner's mistakes in PL/SQL - Part 4

In this post we’ll have a final look on our little PL/SQL program as this is going to be an end to our Beginner's mistakes in PL/SQL series ... for now ;).

We’ll going to take a look at last (yet very important) structural flaw in our PL/SQL code. If we take a closer look at our code, we’ll discover that there are several function calls in main data fetch cycle. 

We are talking about functions:
  • get_indexes
  • has_nullable
  • has_default
  • get_columns

If we look at them, we’ll discover that pure goal of these functions is to produce concatenated list of indexes and columns for particular object or to provide a flag on existence of nullable columns and defaults.

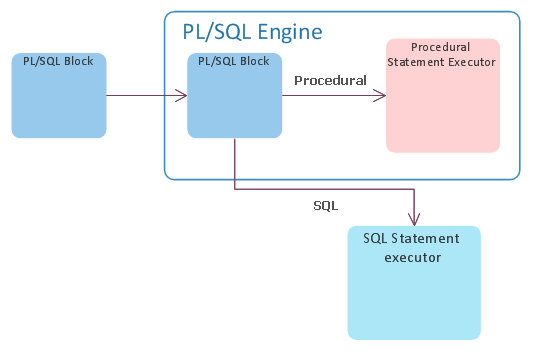
This approach has a HUGE negative impact on performance. Reason for that is an event we call “the context switch”. This event occurs because Oracle has two language processing engines:
  • Database engine – which has SQL statement executor (he knows how to execute and process SQL statements)
  • PL/SQL engine – which is capable of processing PL/SQL procedural language

Here is a nice picture of how your PL/SQL code processing looks like in Oracle:


So, every time PL/SQL engine sees an SQL statement, he basically takes it and sends it to the database engine for execution and waits for results. This act of “outsourcing” is what is called context switch and is quite CPU expensive. This phenomenon is not only about execution your SQL but also about receiving data from it. In our example, the code creator is nicely fetching data from main select by 5000 rows into an array, so he does not need to ask SQL engine for every row. He just asks for next batch of 5000 hence minimizing number of context switches while fetching the data.

Our goal is that if we have to call a SQL statement, we want to get most out of it. We want to get our data, play with it, and when we are done, ask for next batch of them.

It seems that in this case the programmer didn’t see any efficient way (or any way at all) how to get the information he needs from main query. My guess is that the issue here was the pivoting. He didn’t know how to take the list of indexes (or columns) and produce that list as one line. Because this is a simple concatenation problem; one function comes to my mind – LISTAGG. It’s basically an aggregation by concatenation function. Only limitation we have here is that LISTAGG cannot produce string longer than 4000 bytes (for purposes of this demonstration we’ll pretend it’ll never happen :) ).

So, we know now that we CAN put EVERY function we listed above into our main SQL statement and thus eliminating number of context switches by huge amount. We'll not only eliminate the function calls but also the bunch of context switches that are produced by FOR cycles in those functions.  Here is how it’s done:

1. We’ll have to change our data model a little bit so we can store few new columns

DROP TABLE my_data_tmp
/

CREATE GLOBAL TEMPORARY TABLE my_data_tmp
( table_name VARCHAR2(30) NOT NULL,
partitioned VARCHAR2(3),
temporary VARCHAR2(1),
index_list VARCHAR2(4000),
has_nullable VARCHAR2(1),
has_data_default VARCHAR2(1),
column_list VARCHAR2(4000)
) ON COMMIT DELETE ROWS
/

2. Now we can rewrite our main query as follows

    INSERT INTO my_data_tmp
    SELECT tabs.table_name,
           tabs.partitioned,
           tabs.temporary,
           idxs.index_list,
           COALESCE(CASE WHEN cols.count_nullable > 1 THEN 'Y' ELSE 'N' END, 'N'),
           COALESCE(CASE WHEN cols.count_data_default > 1 THEN 'Y' ELSE 'N' END, 'N'),
           cols.column_list
    FROM my_tables tabs
    LEFT OUTER JOIN
    (SELECT /*+ PUSH_PRED */
            object_id_table,
            LISTAGG(index_name,',') WITHIN GROUP (ORDER BY index_name) index_list
     FROM my_table_indexes
     GROUP BY object_id_table
    ) idxs
    ON (idxs.object_id_table = tabs.object_id)
    LEFT OUTER JOIN
      (SELECT /*+ PUSH_PRED */
              object_id,
              LISTAGG(column_name,',') WITHIN GROUP (ORDER BY column_id) column_list,
              COUNT(CASE WHEN nullable = 'Y' THEN 1 ELSE NULL END) count_nullable,
              COUNT(CASE WHEN data_default = 'Y' THEN 1 ELSE NULL END) count_data_default
       FROM my_table_columns
       GROUP BY object_id
      ) cols
    ON (cols.object_id = tabs.object_id);

I had to use PUSH_PRED hint to force Oracle to push object_id into the subquery so that everything is nice and tidy.

As you can see we were also able to easily get all the flags we needed inside the main query without any extra performance hit. We just took advantage of data we had to read anyway.

Now let us compare run times of old and new version of our code after all the work we had done on it.

Old version:

System FLUSH altered.
PL/SQL procedure successfully completed.
Start tmp 19:55:10
End tmp 19:55:10
Start blob 19:55:10
Exported 3306 rows
End blob 19:56:05

New version:

System FLUSH altered.
PL/SQL procedure successfully completed.
Tmp loaded in         .71 sec
Exported 3306 rows in         .16 sec

Ok that’s 55 seconds vs 0.87 of second. I think that the result is so obvious that we don’t even have to check for stats.

You can download the final package code here:

data_to_ascii.pkb

Thank you for bearing with me through all 4 parts of this series and see you soon.

Monday, April 25, 2016

Beginner's mistakes in PL/SQL - Part 3

Welcome to the Beginner's mistakes in PL/SQL - Part 3. In the last Blog, I’ve posed a question about this particular piece of code:

SELECT COUNT(*) INTO v_num_records FROM my_data_tmp; 

Well the point here is that why should I select the temporary table one more time to count number of rows, if I had it directly at hand before in form of information from cursor - SQL%ROWCOUNT.

Another thing is that there is no application orchestration what so ever in our code. If we try to locate our batch job in v$session view, our only way is by sniffing around and checking active SQL (if it is not run under particular user). Big, big mistake. So we will add some application and stage identification:

dbms_application_info.set_module(module_name => 'data_to_ascii',
                                                    action_name => 'load_tmp_table');

We will add this kind of information into other functions in our package, so that when we observe the session, we can easily see in which state our export is.

Last but not least I do not like our time measurement technique. First problem is, that SYSDATE is basically macro for

SELECT SYSDATE FROM DUAL;

That means that each call is PL/SQL – SQL context switch, which is quite expensive. Secondary it is not very precise, ‘cos it can measure only with precision up to 1 second. PL/SQL has much better tools for time measurement and it’s pure PL/SQL. That means no context switching and precision up to 1/100 of second. That tool is

dbms_utility.get_time;

This function returns PLS_INTEGER. By capturing this number in two points in time, you can get number of 100th of seconds between those two points. It’s very fast and very lightweight. The only thing you should keep in mind is, that counter number can wrap around, so if you measure for “very long time” the difference you’re going to get is nonsense.

After all what was said, sample code from package should look like following:

CREATE OR REPLACE PACKAGE BODY data_to_ascii AS
  --
  -- Number of rows in tmp table
  vg_row_count PLS_INTEGER;
  --
  -- Loades data into the temporary table
  --
  PROCEDURE load_tmp_table
  IS
    v_start PLS_INTEGER := dbms_utility.get_time;
    v_end   PLS_INTEGER;
  BEGIN
    --
    -- Orchestration
    --
    dbms_application_info.set_module(module_name => 'data_to_ascii',
                                     action_name => 'load_tmp_table');
    --
    DELETE my_data_tmp;
    --
    INSERT INTO my_data_tmp
    SELECT tabs.object_id,
           tabs.table_name,
           tabs.partitioned,
           tabs.temporary
    FROM my_tables tabs;
    --
    -- Get number of lines processed which is number of rows in temporary table
    --
    vg_row_count := SQL%ROWCOUNT;
    --
    -- Measure
    --
    v_end := dbms_utility.get_time;
    dbms_output.put_line('Tmp loaded in ' || TO_CHAR((v_end - v_start) / 100, '999,999.99') || ' sec');
    --
  END load_tmp_table;
  ...

Continue to Part 4.

Monday, April 18, 2016

Beginner's mistakes in PL/SQL - Part 2


In the last blog post we’ve setup an example with some interesting errors which beginners in Oracle PL/SQL tend to do.

In this post we’ll take a look at one of them and hint another one.

First, let us observe very strange behavior on list of indexes. If I’ll run following query:

SELECT LISTAGG(index_name, ',') WITHIN GROUP (
ORDER BY index_name) index_name
FROM my_table_indexes
WHERE object_id_table=69048
GROUP BY object_id_table;

I’ll get this result:

SYS_C004167,SYS_IL0000069048C00004$$,SYS_IL0000069048C00007$$,SYS_IL0000069048C00015$$,SYS_IL0000069048C00016$$,SYS_IL0000069048C00017$$,SYS_IL0000069048C00022$$,SYS_IL000 …

Now, I’ll put this declaration in our package specification, which will allow me to run it from “outside” :

FUNCTION get_indexes ( p_object_id_in my_data_tmp.object_id%TYPE ) RETURN VARCHAR2;

And I’ll try to get same result from our function as it definitely has to be same:

SET SERVEROUTPUT ON;
BEGIN
 dbms_output.put_line('idx name:' || data_to_ascii.get_indexes( 69048 ));
END;
/

PL/SQL procedure successfully completed.
idx name:

Well that didn’t work out. But how is it possible?

If we check the code, one particular part should cache out eye:

FUNCTION get_indexes ( p_object_id_in my_data_tmp.object_id%TYPE ) RETURN VARCHAR2
  IS
    v_text VARCHAR2(1024);
  BEGIN
    --
    -- Select and concat indexes
    --
    FOR l_sel IN (SELECT index_name FROM my_table_indexes WHERE object_id_table = p_object_id_in ORDER BY index_name)
    LOOP
      v_text := v_text || l_sel.index_name || ',';
    END LOOP;
    --
    RETURN( v_text );
    --
    -- Error handling
    --
    EXCEPTION
      WHEN NO_DATA_FOUND THEN
        RETURN('');
      WHEN OTHERS THEN
        RETURN('');
  END get_indexes;

Yes … WHEN OTHERS THEN. Basically what it says is following “Whatever something else goes wrong, just return empty string” and that’s what will Oracle do. Corrupted block? Return empty string. Buffer overflow? Return empty string.

You would be surprised how often I do see this. My advice is: Just don’t do it. You’ll get wrong results when something goes wrong and you’ll have NO IDEA why. You’ll spend days by reproducing error which might never happen again. If there is an error, let it fail and handle the error based on your business (log it, etc.).

So let’s see what went wrong. I’ll delete general exception handling and rerun the block:

ORA-06502: PL/SQL: numeric of value error: character string buffer too small
ORA-06512: at "DATA_TO_ASCII", line 35
ORA-06512: at line 2
06502. 00000 -  "PL/SQL: numeric or value error%s"

Ok. That’s much better. Now we see that there is a problem with size of our v_text variable. Apparently concatenation of index names for this table is longer than 1024 bytes. So what we will probably do is to increase it.

Now, I should point out that your data might differ so you’ll have to find our own object id, which makes same problem as mine.

First problem solved. Now let’s take a bite in next one, shall we? I really do not like this line:

SELECT COUNT(*) INTO v_num_records FROM my_data_tmp;

Do you like it? What change would you make?

Continue to Part 3.